Stacking works as a filter. A single imbalance is often noise. A cluster of three is rarely random. The more consecutive imbalances, the higher the probability of continuation.
Footprint Patterns
Beginner7 min read
Imbalances, POC, delta — these are elements. Patterns are their combinations that repeat and produce trading signals.
Stacking: clusters of imbalances
A single imbalance is an event. It could be random: a burst of algorithmic activity, a large order, noise. Two in a row on adjacent levels — less likely a coincidence. Three in a row — a pattern: across this section of the candle, one side is systematically overwhelming the other, level by level.
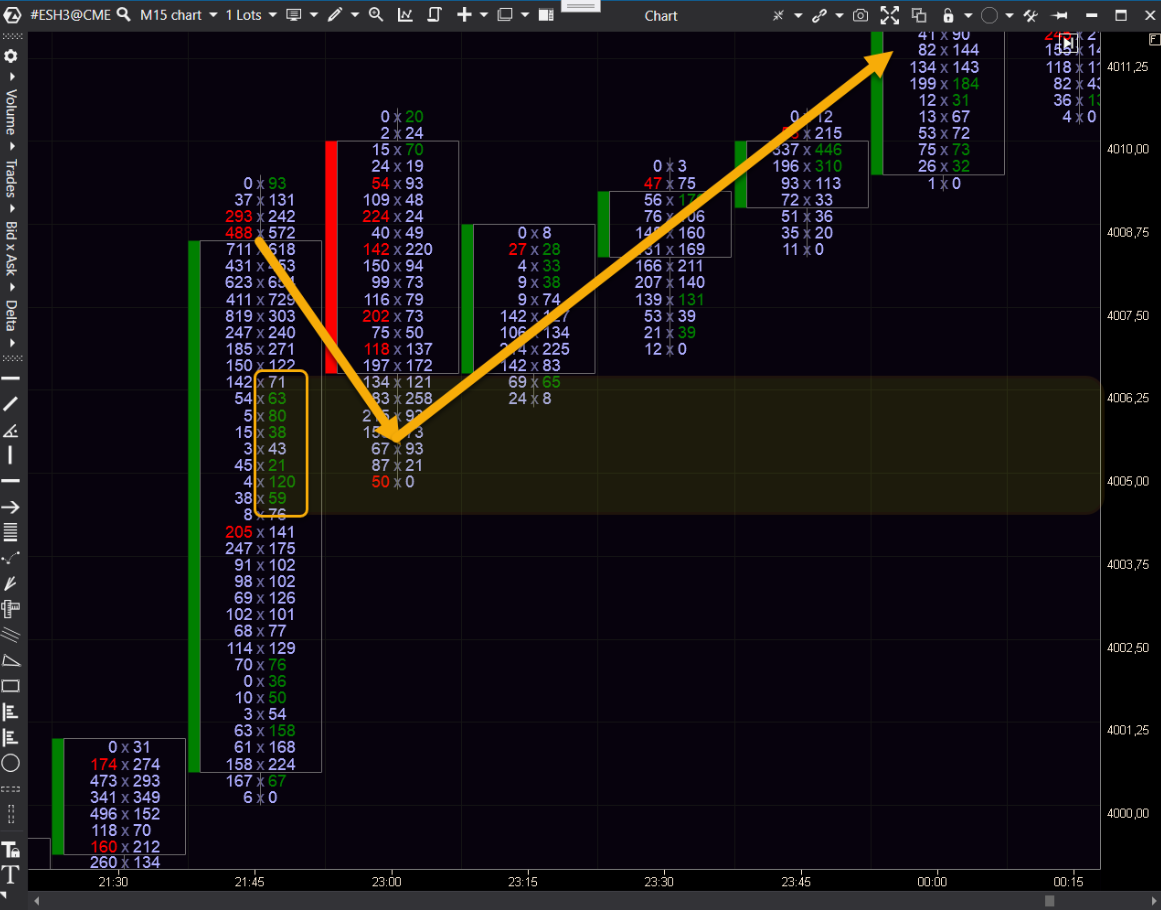
In our candle from the previous lesson, there were two consecutive sell imbalances (5524.75 and 5525.00). Two is noticeable. Three or more in a row is a strong signal of initiative-driven movement. The market did not just "move" — one side is steamrolling through level after level, and each level confirms: this is pressure, not randomness.
Here is what strong stacking looks like — four consecutive sell imbalances at levels 5522.50-5521.75 (hover over the red cells):
Finished and unfinished auctions
Look at the candle edges. At the high (5526.00): bid = 0, ask = 52. At the low (5524.75): bid = 85, ask = 0. On each edge, one column is zero.
Zero on an edge = finished auction. Price reached that level, tried to go further, found no interest, and reversed. The opposite side did not trade — meaning the market "settled the question" at that price. Everything that needed to be discovered has been discovered.
Sometimes it goes differently. Suppose the candle low shows: bid = 85, ask = 28. Both sides traded at the lower edge. Sellers pushed lower, buyers pushed back up, the candle moved on, but the dispute is not settled. This is an unfinished auction — non-zero values on both sides of the edge. Price will likely return here to "retest": the market needs to finish the conversation.
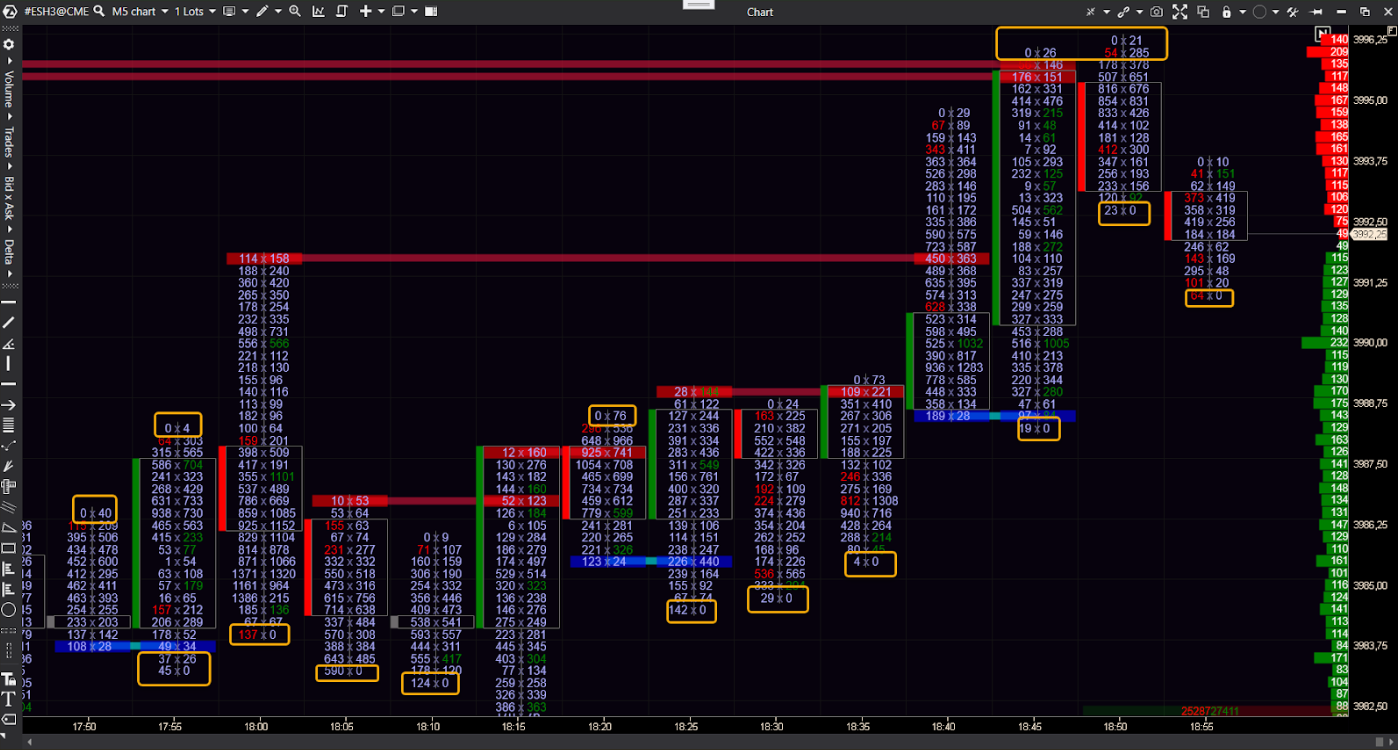
Compare two scenarios — on the left both edges are finished (zeros), on the right the low has an unfinished auction:
There are specialized indicators that display finished/unfinished auctions. In the image below, horizontal lines mark unfinished auctions, while rectangles highlight finished ones.
Absorption: from the fruit market to numbers
In Module 1 we saw absorption through a metaphor: the seller pulls new goods from under the counter, the buyer takes them, the seller pulls out more. Massive volume, price stands still.
In the footprint, absorption looks like this: at a single level, enormous volume on both sides. Both bid and ask are packed with contracts. Level delta is close to zero. Price does not move or barely creeps.
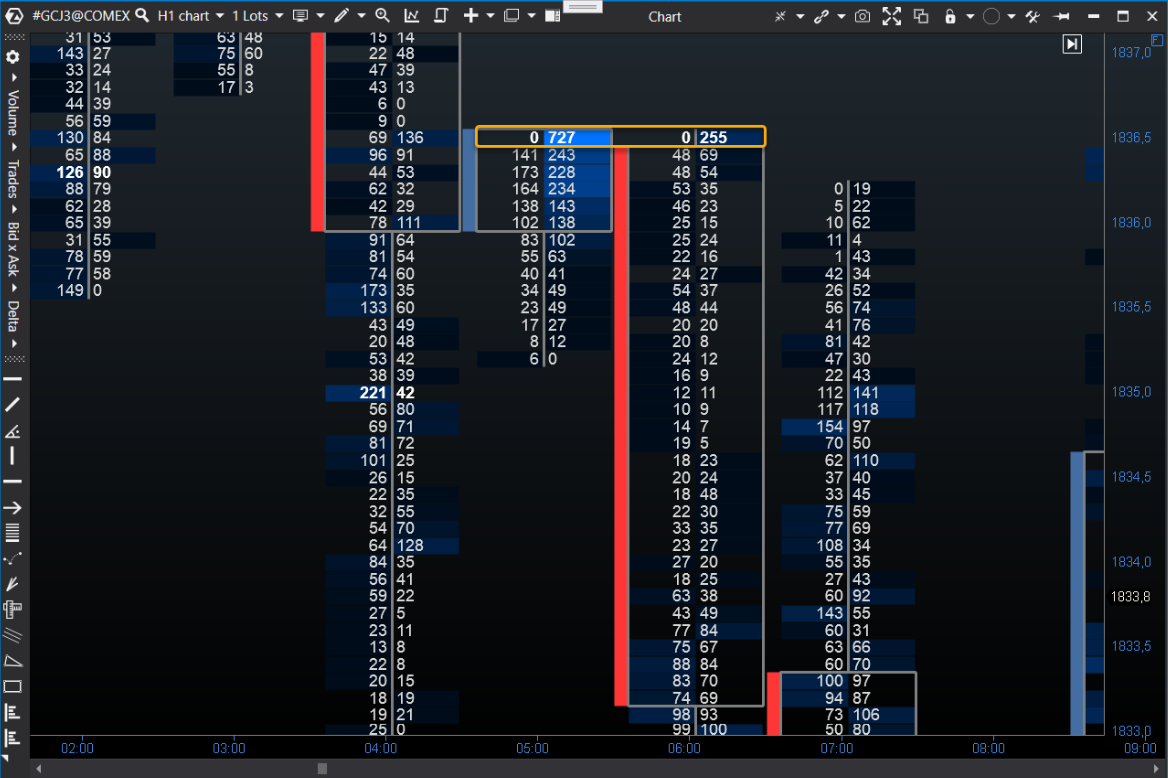
ES, level 5520.00. Footprint for a 5-minute candle — a doji, price barely moved:
1,400 contracts at a single level — fifteen times more than on adjacent levels. Ask = 1,285 — aggressive buyers hit resting limit sellers at 5520.00 over and over. Bid = 115. Buyers dominated absolutely. Yet price stands still.
Translated into fruit-market language: buyers kept coming and taking goods off the shelf. 1,285 contracts. One order after another. And the passive seller kept pulling new goods from under the counter and restocking at the same price. Buyers attacked — price did not budge. Because someone was standing on the other side and absorbing the entire flow.
The absorption signature: anomalous volume at a level + one side clearly dominates + price stands still. Delta screams "buyers!" yet the result is a doji. On a candlestick chart — nothing: a small candle, a passing moment. In the footprint — fifteen hundred contracts and an invisible defender of the level. The X-ray sees it. The photograph does not.
Buyers exhaust themselves, and price drops — the entity that absorbed has built a position and controls the level. Or the opposite: the absorbing side cannot hold, and price breaks through. Both outcomes are real. Absorption is not a forecast — it is a fact: someone is standing there and absorbing. What happens next depends on whether they have enough "inventory."
Consider this example: at the highlighted price, large volume is being traded via market buys with zero market sells. This means all buyers are "hitting" a limit order and cannot break through it. The bid price never stood at the highlighted level, and not a single sell was executed there.
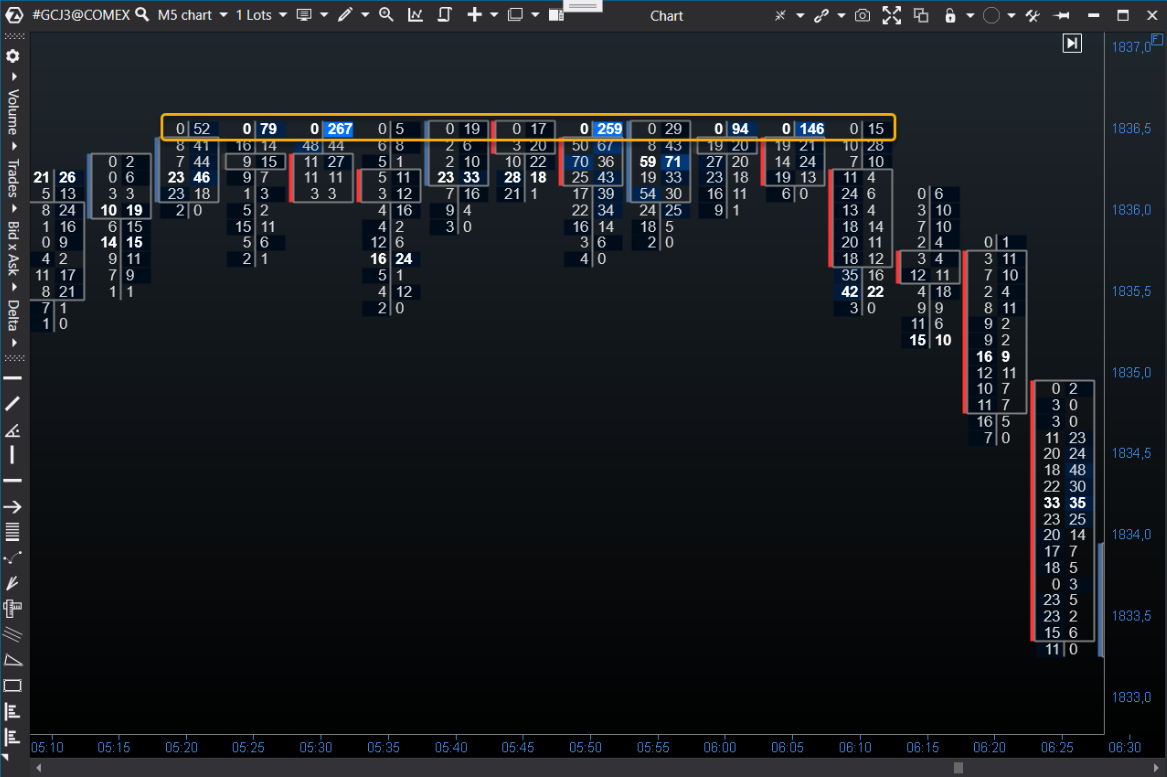
 If we look at the same chart section on a smaller timeframe, we can see the detail: there was simply a "wall" of a limit order that could not be broken.
Quiz
1. Three consecutive sell imbalances at levels 5524.50, 5524.75, and 5525.00. What is this?
2. At level 5520.00, 1,400 contracts traded (bid 680, ask 720), delta +40 (3%). Adjacent levels show 100-150 contracts. What do you see?
3. Footprint candle low: bid = 85, ask = 28. Is the auction finished?
AI Assistant
Footprint Patterns
How can I help?
Ask anything about this lesson